
Measuring user experience (UX) is essential to ensure that users' interactions with a product are effective, enjoyable and meet your needs. Using indicators of key performance indicators (Key Experience Indicators - KEIs), UX teams can continually improve the product design based on quantitative and qualitative data. Below are some of the main KEIs that you should track to improve the user experience of your product.
1. Net Promoter Score (NPS)
What is it? NPS measures user loyalty by asking them how willing they would be to recommend the product to other people. It is widely used as an indicator of overall satisfaction. Why is it important? This indicator helps to understand the user's perception of the product and to determine whether users are willing to promote it. The answer to this question may influence retention and marketing strategies. How to use? Ask users: "On a scale of 0 to 10, how likely are you to recommend our product?" Divide users into three categories:
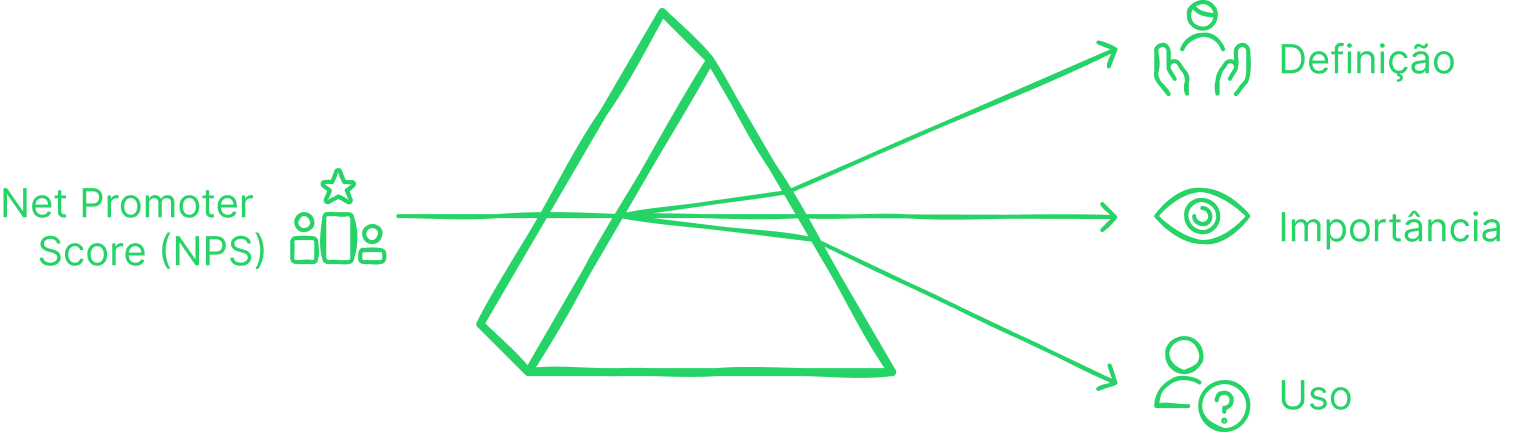
- Promoters (9-10)
- Neutrals (7-8)
- Detractors (0-6)
The formula to calculate NPS is: NPS = % Promoters - % Detractors
Sources: Tomer Sharon, MeasuringU
2. User Satisfaction (CSAT)
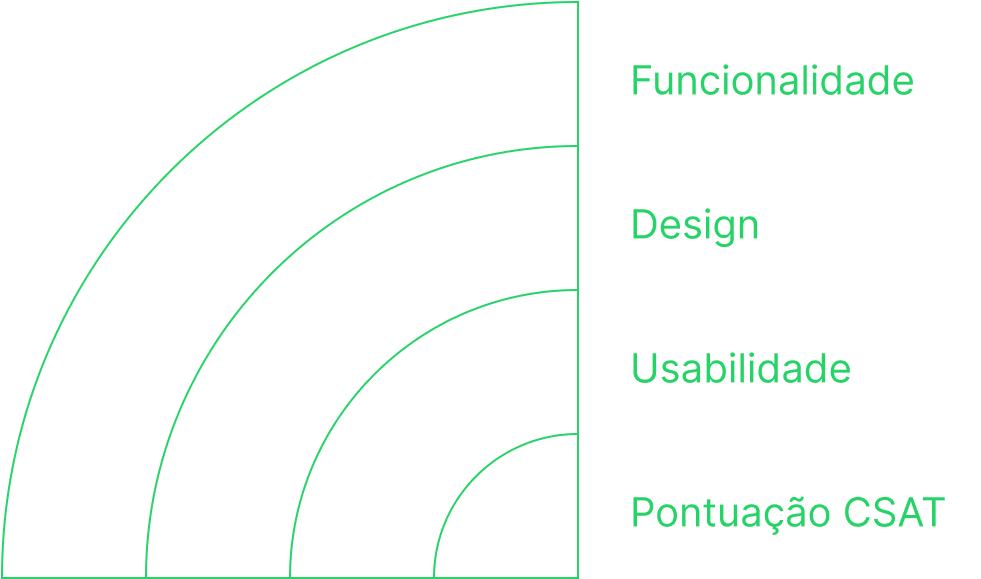
What is it? The CSAT metric measures user satisfaction with specific aspects of the product, such as usability, design and functionality. Why is it important? It is essential to understand how satisfied users are with the product in question. specific feature terms, which can guide design improvements or adjustments. How to use? After key interactions, such as completing a task, ask: "How satisfied are you with Do you have your experience today?" on a scale of 1 to 5. The average of the responses will provide the score CSAT.
Sources: UX Design, UsabilityGeek
3. Adoption Rate
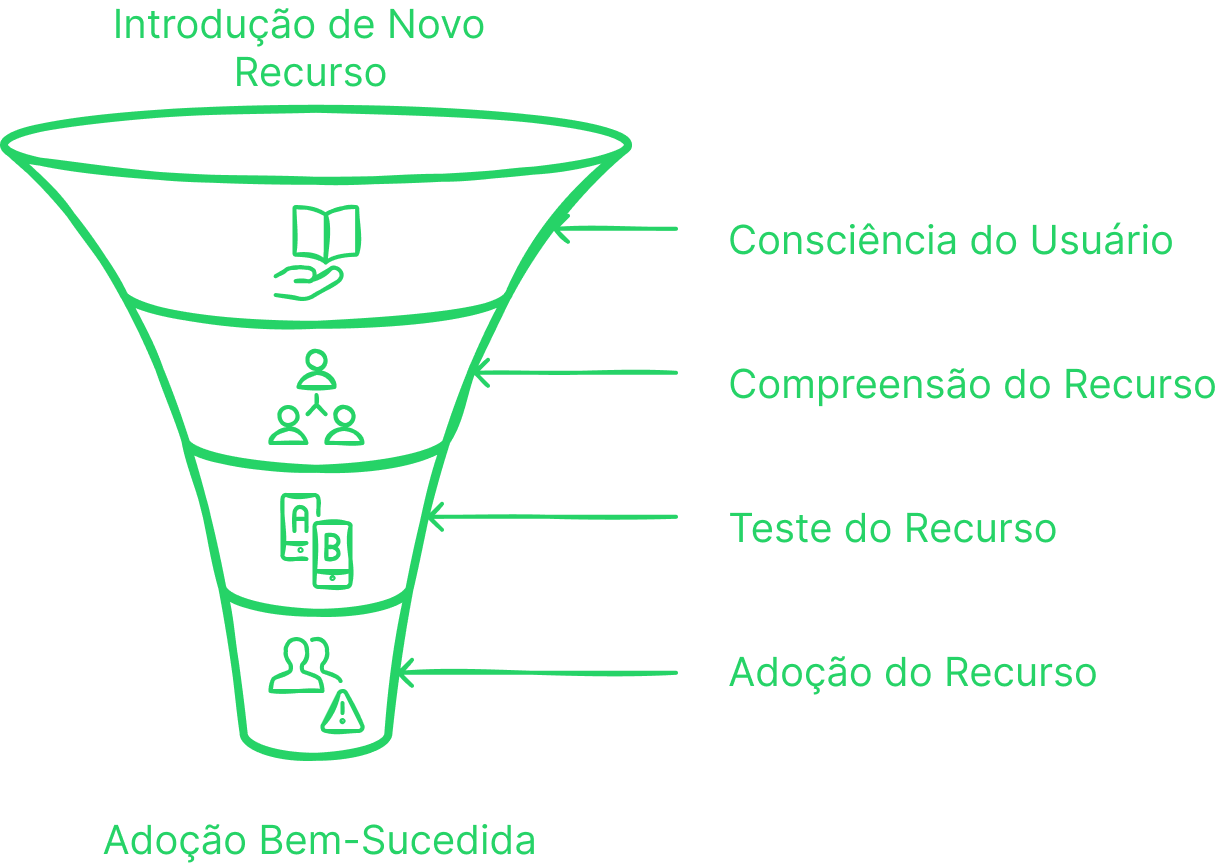
What is it? Adoption Rate indicates the percentage of users who started using a new feature or functionality within the product. Why is it important? This metric helps measure the success of new features or product changes. Low adoption rates may indicate that the new functionality has not been implemented well or that the users did not understand its value. How to use? Calculate the percentage of users adopting a new feature out of the total number of users during a specific period.
Sources: UsabilityGeek, MeasuringU
4. Retention Rate
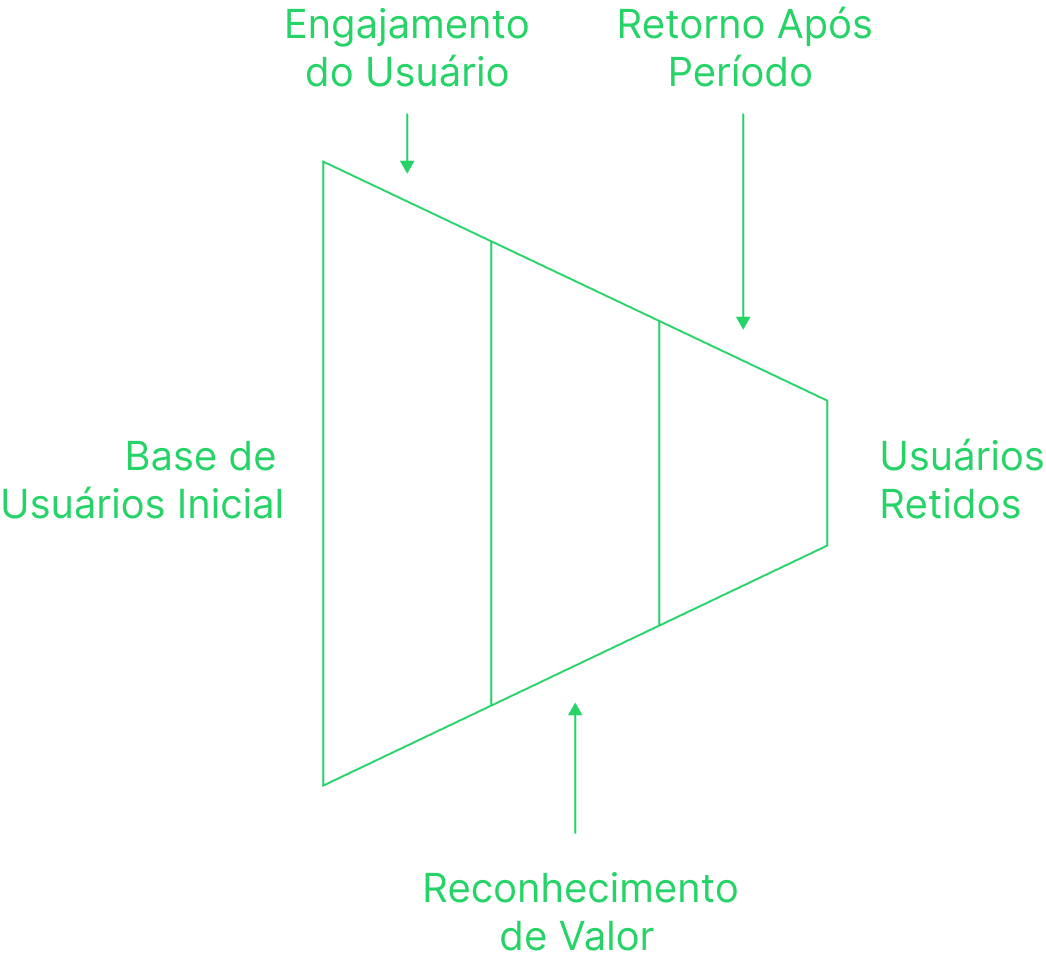
What is it? Retention Rate measures the percentage of users who continue to use the product after a certain period of time. Why is it important? A high retention rate suggests that users find ongoing value in product. If the rate is low, you may need to analyze what users are doing give up, such as bugs or features not meeting expectations. How to use? You can calculate retention by comparing the number of users who come back after a certain period (e.g. 30 days) with the total number of initial users.
Sources: UsabilityGeek, MeasuringU
5. Abandonment Rate
What is it? Abandonment Rate measures the percentage of users who begin performing a task, but the interrupt before completing it. Why is it important? A high abandonment rate may indicate difficulties in the interaction flow or obstacles that make performing tasks difficult or frustrating. How to use? This KPI can be calculated by dividing the number of users who abandoned a task by the total number of users who started the task.
Sources: UX Design, Tomer Sharon
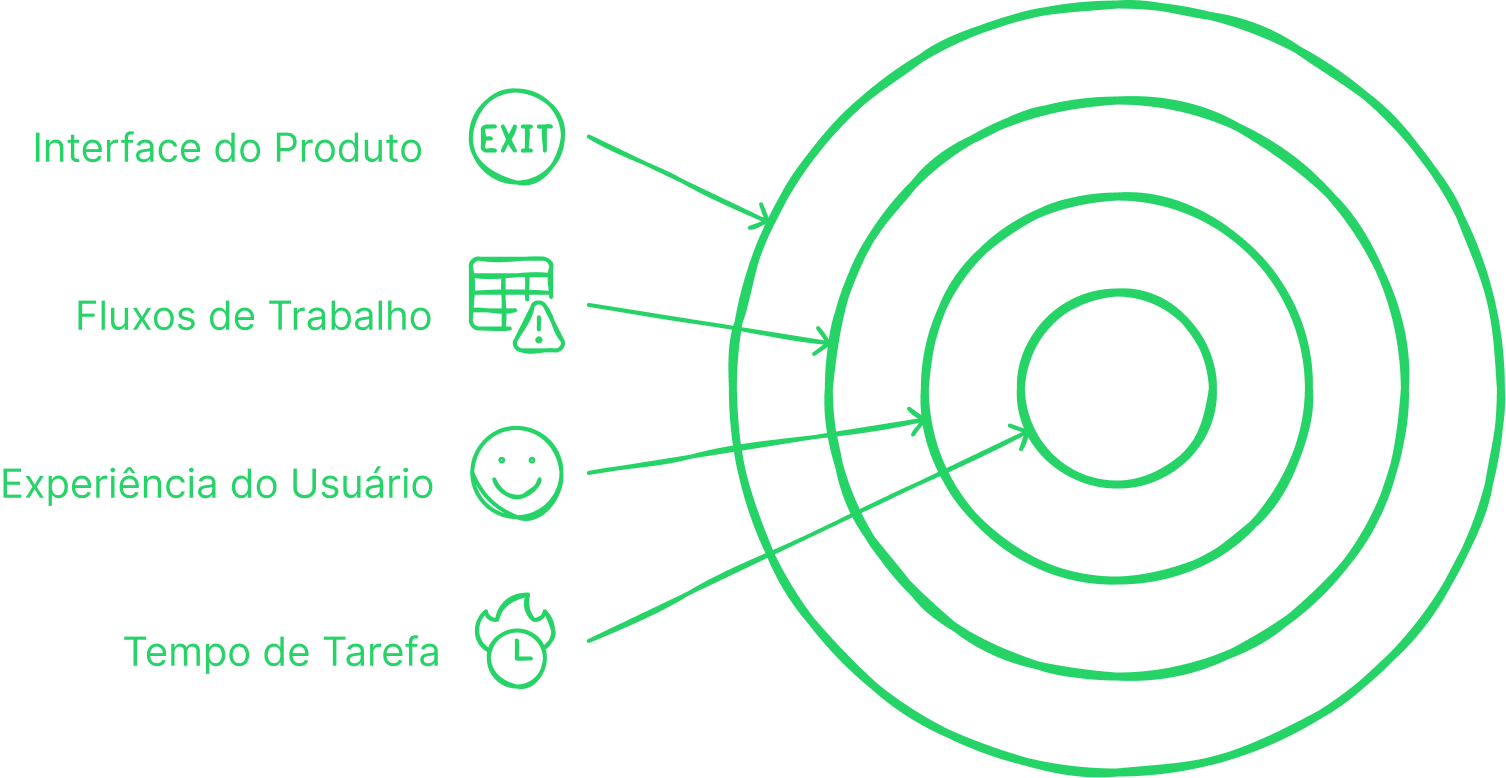
6. Time on Task
What is it? This metric measures the average time it takes users to complete a specific task on the product. Why is it important? Evaluating the time spent on tasks allows you to identify flows that can be optimized to make them faster and more efficient, improving the user experience. How to use? Monitor the time users spend completing critical tasks within the product. This indicator can reveal difficulties and areas where the interface can be more efficient.
Sources: Usability Geek, MeasuringU
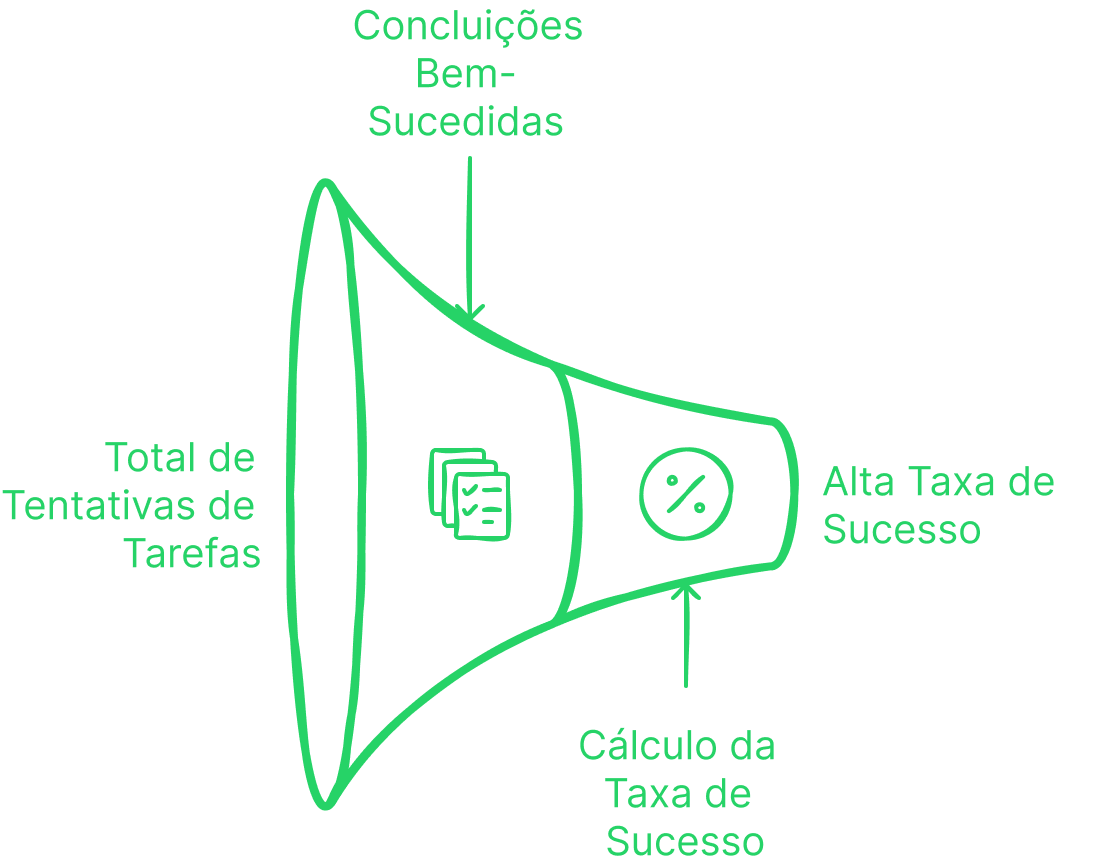
7. Task Success Rate
What is it? Task Success Rate measures the percentage of users who are able to complete a task. task successfully during interaction with the product. Why is it important? This metric is a direct reflection of how the product design facilitates or makes user actions difficult. A high success rate indicates that the design is intuitive and effective. How to use? Calculating the number of users who successfully complete a task and dividing by total number of attempts, you can determine the success of your interface.
Sources: Tomer Sharon, MeasuringU
Conclusion
By integrating these Key Experience Indicators (KEIs) into your UX strategy, you create a solid foundation of data to improve the user experience continuously and proactively. Measure indicators such as NPS, Retention Rate, Adoption Rate, and Task Success Rate allows you to make decisions more informed, as well as offering a clear view of the areas that need attention. The key is collect this data, analyze the results, and make design adjustments to improve the user experience constantly.
Did you like the article? Share your opinions and experiences! How does your organization work with AI? Let's go continue this conversation and learn together.